FSU’s Dropping Undergraduate Enrollment
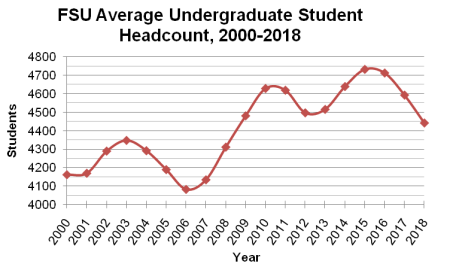
Undergraduate students make up the bulk of FSU students, but their numbers are quickly dropping. There may be a national upward trend in undergraduate enrollment, but FSU seems to defy that trend. [See Figure 1] Enrollment for undergraduate students in fall 2018 totaled 4,638 students, which is over 300 students less than FSU’s all-time peak of undergraduate students in fall 2015. A 300-student drop in the fall semester may not seem like much, but it means that FSU’s total undergraduate enrollment is nearly at the same level as seen in fall 2012. Another 300-student drop would put fall undergraduate enrollment at levels seen in fall 2007.
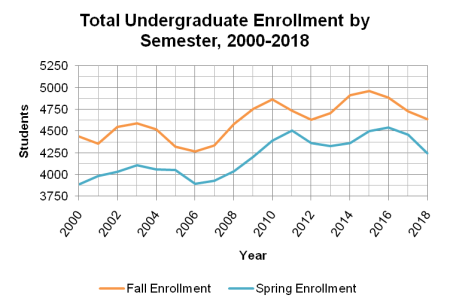
Enrollment totals normally fluctuate between fall and spring semesters – fall semesters have high undergraduate
enrollment, while spring semesters have low undergraduate enrollment. [See Figure 2] Enrollment for undergraduate students in spring 2018 totaled 4,244 students, which is nearly 300 students short of the spring all-time undergraduate enrollment peak in spring 2016. Another 300-student drop in the spring semester would put the enrollment levels near those seen in spring 2007.
The all-time recorded low in enrollment since 2000 for both spring and fall semesters was in 2006. As the fall semester comes to an end, the big question is: how much will spring enrollment drop this time? This fluctuation between fall and spring enrollment totals is normal for FSU, but some university administrators are concerned about the upcoming drop. “I can tell you, at this school and every other school, there is a fall, there is a drop. It’s not a question of whether there is a drop, but rather of how much the drop will be,” Interim Director of Residence Life Carl Crowe said.
Aspects of Enrollment: Continuing Students
Although the total numbers are dropping, there are other factors to take into consideration. Continuing students, those students who were previously enrolled at FSU and chose to continue their enrollments, constitute a majority of FSU’s undergraduate enrollment. “The decline we saw in enrollment this year was not with new students coming to FSU, but rather a drop in continuing students,” University President Ronald Nowaczyk said.
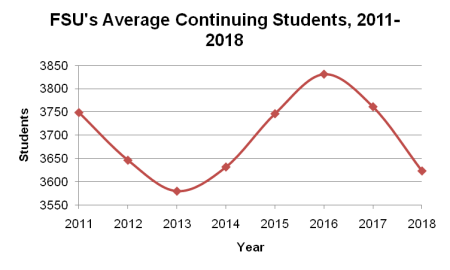
There was a decrease in the number of continuing students between fall 2018 and fall 2017, but this is following a trend that started in 2016. Most importantly, the decrease in continuing students between fall 2017 and fall 2018 is double the decrease between fall 2016 and fall 2017. Although this is only two years of information, the trend of decreasing continuing students has picked up speed. [See Figure 3]
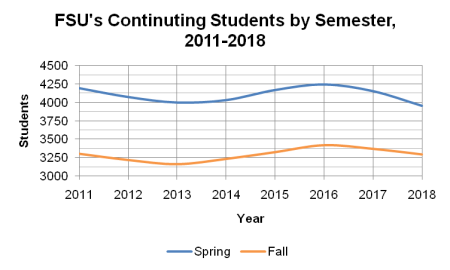
This trend is reflected in the decrease of continuing students in the spring semesters as well. Spring 2016 counted 4,245 continuing students, while spring 2017 counted 4,154 continuing students – a decrease of 91 students. Spring 2018 counted 3,953 continuing students – a decrease of 201 students from spring 2017. Again, the trend of decreasing continuing students has expanded twofold, even more so in this case. [See Figure 4]
Provost Elizabeth Throop sees another problem arising from dropping continuing student enrollment – student retention. “We need to continue to work on retaining students once they get here – we can do a better job with our first to second year retention and our four and six year graduation rates. That will make a big difference in our numbers,” she said. Vice President of Enrollment Management Arlene Cash echoed her commitment to examining student retention numbers with a focus on student support and success.
In short: Although the trend in decreasing continuing students only spans two years, that trend has rapidly increased in two years. University administrators recognize that student retention levels can be improved.
Aspects of Enrollment: Transfer Students
Some students opt to go to a two-year college before they enter a four-year university. These students are classed as transfer students, and they make up a small part (about 10 percent) of FSU’s undergraduate enrollment. “More students are choosing to attend a local community college for the first year or two and then transfer to FSU. We’ve seen an increase in transfer students over the past several years,” President Nowaczyk said. Yes, community colleges do tend to be a cheaper alternative. However, the increase in transfer students might be negligible.
Provost Throop echoed President Nowaczyk’s statements about the growth in transfer students. “A big area of growth for us is transfer students,” she said. “My office is working on making transfer as seamless as possible, so I’m putting together agreements with our feeder community colleges so that everything is spelled out and transfer students know exactly what they need to do to successfully complete their programs.”
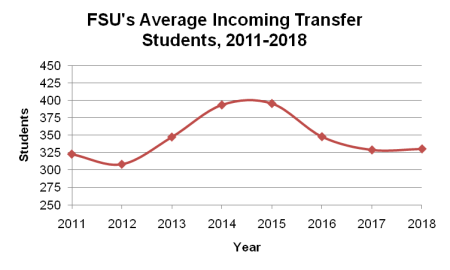
Yes, there was a somewhat major increase in the number of transfer students in the past – from 2012 to 2015, the average number of transfer students increased from 309 to 396. However, that number steeply dropped the next two years – from 2015 to 2017, the average number of transfer students dropped from 396 to 329. From 2018 to 2019, the average number of transfer students increased by two students, from 329 to 331. So yes, there has been an average increase, but only by two students. [See Figure 5]
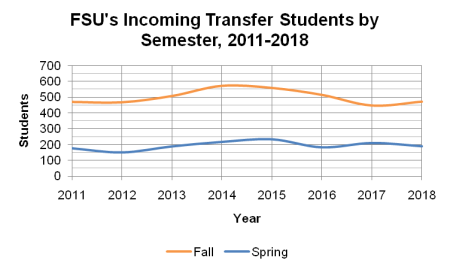
The averages for transfer students do differ from the raw values by semester. In fall 2017 there were 448 transfer students, and in fall 2018 that number increased to 472. However, in spring 2017 there were 210 transfer students – the number of transfer students dropped to 189 in spring 2018. [See Figure 6]
In short: On average, the number of transfer students has increased by a negligible amount. On the basis of raw values by semester, the number of transfer students has increased between fall 2017 and fall 2018, but the number of transfer students has decreased between spring 2017 and spring 2018.
Aspects of Enrollment: Online Students
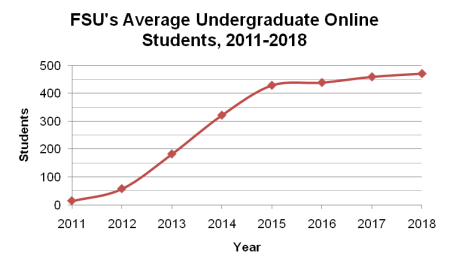
Like transfer students, online students make up a small part of FSU’s total undergraduate population. FSU first began recording its undergraduate online enrollments in 2011 and since then the numbers have risen rapidly. Starting from zero, enrollments in undergraduate online programs jumped up to over 450 students by fall 2015. “We have seen significant growth in enrollments in online programs reflecting the changing nature of today’s college student population,” President Nowaczyk said.
Since the initial enrollment spike of 456 students in fall 2015, however, the enrollment totals have risen only slightly. Currently, undergraduate online enrollment is at its all-time peak of 483 students. On average, the undergraduate online program has only increased by 10 to 20 students per year since 2015. [See Figure 7]
In short: Undergraduate online student enrollments grew rapidly for four years, but since 2015 they have been only a very slowly growing part of FSU’s undergraduate population.
The Big Question: Why is Enrollment Down?
“In general, college-aged populations are dropping – in western Maryland and across the country,” Provost Throop said. In part, that is true – according to the Western Interstate Commission for Higher Education (WICHE), the national number of high school graduates has been dropping at a steady rate since 2018. However, 2018 and 2019 are projected to have a brief spike in high school graduates, before the number again drops in 2020. From 2020 onward, the number of projected high school graduates nationwide is expected to rise.
The Northeast has been taking much of the brunt of this decrease in high school graduates – the total number of high school graduates peaked in 2010, and has been fulfilling a downward trend since then. This downward trend is projected to continue into the foreseeable future. “Part of the decline in enrollment is due to fewer high school students in the pipeline for college. FSU is not unique among state and private institutions of higher education that face enrollment challenges,” President Nowaczyk said.
While this downward trend in high school graduates may be unique to Frostburg and the Northeast, other parts of the nation are not facing the same issue. The Southern and Western regions of the country are seeing an upward trend in high school graduates, according to the WICHE. Although the drop in high school graduates may be affecting FSU, it is not affecting the rest of the country equally.
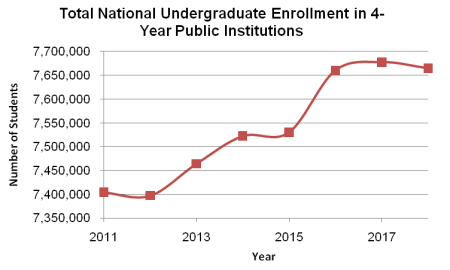
Is undergraduate education suffering overall? Somewhat, but universities like FSU have generally been thriving. Although four-year for-profit universities and two-year public colleges have suffered from declining enrollments in the past few years, four-year public universities like FSU have been experiencing a steady upward trend in undergraduate enrollment. Although national enrollment estimates dropped slightly from 2017 to 2018, four-year public institutions saw steady growth in enrollment rates from 2012 to 2017. [See Figure 8]
Vice President of Enrollment Management Arlene Cash started her work in early October of this year. “Certainly, I have not had time to analyze (let alone gather) much of the data that would allow me to make a definitive statement on why we are experiencing a downturn in new student enrollment,” she said. “By February I’ll have a better sense of where we are losing students and why.”
In short: Within the region, the number of high school graduates is generally dropping. This may heavily impact new undergraduate enrollments. Nationwide on average, institutions like FSU are thriving – however, FSU stands outside this trend with its dropping undergraduate enrollment rates.
What is the Impact on FSU?
Vice President of Administration and Finance Leon Wyden recognized that the dropping undergraduate enrollment will strain the university financially. “Declining enrollment limits resources,” he said. “FSU has managed to live within those resources. We have balanced our budgets.” It might be fortunate for FSU’s resources that the University System of Maryland (USM) has suggested that FSU raise its undergraduate tuition rates across the board for the ninth consecutive time since 2010.
The notion of a balanced university budget was a key component of the State of the University address earlier in the fall semester. Another issue that came up at that address, though, was the fact that FSU lags behind USM benchmarks for faculty and staff salary rates. Balanced budgets do have a cost though, as professors from multiple departments have complained about budget cuts.
President Nowaczyk takes a student-focused stance when it comes to the impact of dropping undergraduate enrollment on FSU. “For us, we need to continue to focus on helping students get their college degrees once they enroll at FSU. That means providing teaching resources to faculty and students. We are not interested in lowering standards either at the time of admission or while the students are taking classes at FSU,” said President Nowaczyk.
Provost Throop is somewhat concerned about the dropping enrollment levels. “When the new residence hall and the new academic building are built, we will be able to accommodate about 4500 students, including the first and second year students who will be required to live on campus. We’ll have state of the art residences and teaching spaces in just a few years,” she said regarding her concerns.
In short: Less students means less revenue. FSU currently is not using its facilities to their fullest, so there is a further potential revenue loss. The construction of the new buildings on campus may worsen this issue.
What is the Plan?

Vice President of Enrollment Management Arlene Cash is looking into possible ways to boost undergraduate enrollment. Although she started her work on campus near the beginning of October, she remains committed to finding the source of the issue, as well as addressing its effects. “I am focusing on personalizing our outreach, providing prospective students with greater access to our counselors and faculty, getting financial aid award letters out to students earlier, and supporting our team with the technology and resources they need to do their best work,” she said.
Provost Throop is looking at the demand for many of FSU’s academic programs. She said that the university is “developing majors that students are asking for, as well as strengthening majors that we know students want.” In addition to this, Throop is also looking at the effectiveness of FSU’s academic programs and how they can be improved. “We also are looking at specific courses with high failure rates, trying to think through ways that will provide opportunities for students who work at it to be more successful,” she said.
President Nowaczyk directed Provost Throop’s undertaking. Aside from his support of it, he also wants programs to focus on promoting community engagement for students. “For existing programs, we will continue to focus on providing the knowledge and skills required for students to be successful in their careers and engaged citizens,” he said. Increased community engagement has been a key focus of President Nowaczyk’s vision for the university.
Vice President Cash said that the university has applied to be a member of the Common Application Group – an organization with a single application which can be sent to multiple universities quickly and easily – and that she hopes the university’s membership will increase the university’s visibility within the field of competing universities.
In short: The university is looking at which academic programs are successful and which aren’t. The university is trying to expand access to popular academic programs, as well as to improve student success rates in an effort to improve retention. The VP of Enrollment Management is launching initiatives to connect with more prospective students.
What Now?
Budget cuts, low salaries, new buildings, and dropping undergraduate enrollment – what will FSU do?
The university administration has taken steps toward remedying the issue of enrollment, but the future remains uncertain. As the fall semester wraps up, administrators will likely start turning their eyes to FSU’s enrollment monitor to see how much enrollment drops in the spring semester. If the quickening trend of decreasing enrollment continues, then university administrators may be forced to reevaluate their budgets.
Although Vice President Cash is confident in the university’s reach of the non-traditional and pre-professional student populace, she has noted that some of the measures taken to expand the university’s reach to prospective students may take 12 to 18 months to show results.
President Nowaczyk takes a broader view on the situation. “We need to continue our efforts on several fronts: the college students interested in face-to-face education, the transfer students looking to complete their degrees at a four-year institution, either face-to-face or online, and the working adults who are interested in college certificates and/or college degrees, both at the undergraduate and graduate levels,” he said.
Notes on the Figures and Data Provided
The data presented in Figures 1 though 7 comes from FSU’s enrollment monitor, which can be found here.
The data presented in Figures 1, 3, 5, and 7 represents an average of that year’s spring and fall semesters, i.e. spring 2018 and fall 2018 are averaged to produce the data point for 2018 (for the curious, in Figure 1 the average for those semesters is 4,441).
The data presented in Figure 8 comes from the National Student Clearinghouse Research Center, which is the research wing of the National Student Clearinghouse (NCR). The NCR is a non-profit, non-governmental organization which is the “leading provider of educational reporting, data exchange, verification, and research services” for educational institutions. The data presented in Figure 8 represents the estimated spring enrollment in 4-year public institutions.
Data from the United States Department of Education’s research and reporting wing, the National Center for Education Statistics (NCES), was not used in this article. Data from the NCES would have preferably been used in Figure 8 and throughout the article, but relevant data from the NCES was not current and has not been updated from projected figures since 2016. The data which is available from that source shows a steady growth in enrollment in 4-year public institutions up until 2016. The projected data beyond 2016 shows a one-year drop in enrollment levels in 2017, followed by a steady growth in enrollments in 2018 and beyond. (Source)
